How does a hashtag transform a nation? For my undergraduate thesis, I analyzed how #BlackLivesMatter spread across Twitter in the week after George Floyd was murdered.
You can read the full thesis (PDF) or browse the code on GitHub. The project received high honors, “awarded by faculty vote for truly exceptional work.”
This research has not been peer-reviewed and I encourage skepticism when interpreting its conclusions, but the work may still be of the public interest, given that it uses data which may no longer be accessible to researchers since the discontinuation of Twitter’s Academic API.
Rest in peace, George Floyd.
Key Findings
- Twitter ‘power-users’ led early virality. Early hashtag adopters followed more accounts, had more followers, and tweeted more often than those who chimed in later. Among geolocated users, almost all had used the hashtag before. These users may represent an activist core that directs mainstream attention after incidents of police brutality.
- Americans in the densest urban areas drove hashtag adoption. Population density mattered far more than any other neighborhood characteristic in predicting the per-capita rate of geolocated hashtag adopters.
- Analysis of online behaviors must consider offline factors. When attempting to model hashtag adoption, models based on the rate of news articles about the movement performed better than models based on hashtag adoption among users’ friend networks did.
Technical Highlights
- Scale: Used Twitter’s Academic API to collect 14 million tweets, 5+ million unique users
- Stack: Primarily Python (pandas, scikit-learn, NumPy, feather); D3.js for the charts on this page
- Geographic Data Analysis: Inferred adopters’ locations from geotags’ bounding boxes, joined external datasets (US Census, American Community Survey, Mapping Police Violence) to deepen analysis
- Machine Learning: Lasso regularization for feature selection, K-means clustering for grouping users into descriptive groups
- Simulations: Probabilistic agent-based models, grid search for parameters, Monte Carlo simulations to randomize login behavior, scored by least-squares fit against real hourly adoption
Why study a hashtag?
The upheaval in the aftermath of George Floyd’s death may have been the largest protest movement in American history. Millions surged into the streets despite the risk of doing so in the midst of a pandemic. This was a transformational event.
The Black Lives Matter movement has been intertwined with social media ever since Alicia Garza wrote the phrase on Facebook in the aftermath of the George Zimmerman verdict and Patrisse Cullors turned it into a hashtag (Garza and Kauffman 2015; Brown 2015). To understand Black Lives Matter, we must understand its digital roots.
Overall Trends
Using Twitter’s Academic API, I downloaded all public tweets containing #BlackLivesMatter in the week of George Floyd’s death on May 25th, 2020, representing 14,176,614 tweets from 5,091,940 unique adopters.
Hashtag adoption quickly rose the morning after the video of Floyd’s death was posted online, peaking first on May 28th, as protests took root nationwide, and rising again towards the end of the week as the protests and police combat dominated the national conversation.
Early adoption was driven by Twitter “power users” who had more followers, followed more people, and more lifetime Tweets than those who adopted the hashtag later in the study period.
Given how episodic hashtag usage is (Ince et al. 2017), the early adopters may represent the seed population — an “activist core” that directs mainstream attention to incidents of police brutality.
A Global Phenomenon
Twitter collects minimal information on demographic characteristics, but it does provide another powerful source of information: geotags. About 0.6% of public #BlackLivesMatter tweets contained geotags.
I inferred the location of the authors of these tweets by examining all of their geotags in the study period.
For each user, their home country was considered the modal country represented in their geotags, using a coin-toss in event of a tie.
A narrow majority (51.4%) of geotagged #BlackLivesMatter tweets actually came from outside the US. The top foreign countries represented were Great Britain, Brazil, Canada, Nigeria, and South Africa - countries with large Black populations, historical ties to the United States, and/or their own legacies of racial inequality.
Foreign users tended to adopt later as news of Floyd’s murder spread around the world.
Examining Hashtag Adoption by Neighborhood
After filtering out users with foreign, ambiguous, and geographically inconsistent geotags, I determined the county subdivision of 34,379 geolocated adopters.
Geolocated adopters are not representative of the full population - they tend to be power users, with older, more well-connected, active, accounts. We must be careful in interpreting the generalizability of this data. See full thesis (PDF) for discussion on how I determined subdivision.
Adoption by state largely tracked population — California, New York, and Texas led — though Minnesota, where Floyd was killed, ranked unusually high for its size.
What about adopters’ neighborhoods? Where we live deeply shapes our lives, especially given how deeply race and class have shaped our neighborhoods in America.
I examined how county subdivision characteristics predicted per-capita adoption rates, using the American Community Survey (ACS)’s data on income, racial makeup, and population density, as well as the Mapping Police Violence dataset (MPV)’s data on police killings.
Using regression and Lasso regularization, I found that population density was by far the most predictive feature for per capita adoption, followed by White and Black population percentage, White per capita income, and police killings per square mile.
| Feature | Regression | After Lasso (α = 5×10⁻⁶) |
|---|---|---|
| Population Density | +1.70×10⁻⁵ | +1.43×10⁻⁵ |
| Percent White | −8.07×10⁻⁶ | −3.86×10⁻⁶ |
| White Per-Capita Income | +7.31×10⁻⁶ | +1.57×10⁻⁶ |
| Police Killings per Square Mile | +4.90×10⁻⁶ | +1.46×10⁻⁶ |
| Black Per-Capita Income | +3.39×10⁻⁶ | 0 |
| Percent Latino | +3.37×10⁻⁶ | 0 |
| Black-to-White Income Ratio | −2.70×10⁻⁶ | 0 |
| Latino Per-Capita Income | +2.04×10⁻⁶ | 0 |
| Percent Other Race or Multiracial | −1.91×10⁻⁶ | 0 |
| Percent Black | +1.52×10⁻⁶ | +1.18×10⁻⁷ |
| Overall Per-Capita Income | −9.88×10⁻⁷ | 0 |
I then used K-means clustering in order to assemble six clusters of county subdivisions to examine for further analysis. The six resulting clusters were named for their most distinctive traits: Rur.White (low-density, racially homogeneous), Sub.Blacker (medium-density, large Black population), Sub.Richer (medium-density, high-income), BigCities (high-density), SubRur.Poorer, and MidCities (notably, the cluster containing Minneapolis).
Subdivisions by Percent White, White Income & Density (Colored by Cluster)
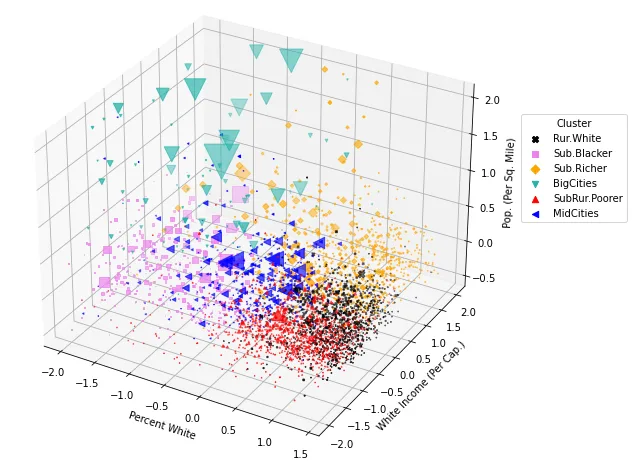
K-means clustering groups objects in a high-dimensional space (in our case, six dimensions), which lets me compare archetypes of subdivisions.
| Cluster | Name | Per-Cap. Income | White Pop. Percent | Black Pop. Percent | Pop. Density (per sq. mile) | Police Killings (per sq. mile) |
|---|---|---|---|---|---|---|
| BigCities | Chicago, Illinois | $37k | 50.0% | 29.6% | 12,021 | 0.37 |
| Sub.Blacker | Airport, Missouri | $25k | 50.5% | 40.9% | 2,197 | 0.06 |
| MidCities | Maplewood, Minnesota | $34k | 68.2% | 10% | 2,388 | 0.06 |
| Sub.Richer | Burlington, Massachusetts | $51k | 74.3% | 4.5% | 2,356 | 0.00 |
| SubRur.Poorer | Alpine, Michigan | $28k | 85.4% | 6.3% | 388 | 0.00 |
| Rur.White | Petersburg, North Dakota | $31k | 91.2% | 1.8% | 165 | 0.00 |
BigCities adopters dominated hashtag adoption by nearly every metric.
There were 9.84 times more geolocated adopters per capita in BigCities county subdivisions than in Rur.White subdivisions, which had the fewest geolocated adopters per capita.
BigCities adopters dominated the network structurally too. Examining relationships between geolocated adopters, every cluster followed more BigCities accounts than accounts from any other cluster, including their own. BigCities adopters also had the densest internal follower network of any cluster.
The importance of the BigCities subdivisions could be interpreted in two ways:
- As indicative of the modern urban-rural political divide in this country, and the age-old dynamic whereby individuals from cities dominate public discourse.
- As the result of individuals living in the most concentrated regions of police violence asserting their voices in the public sphere.
The development of the modern American city has been deeply shaped by racialized policies — redlining, White flight, and broken-windows policing (Derickson 2017). It is perhaps not surprising that support for Black Lives Matter would thrive in such environments.
That being said, two other groups stood out as early drivers of adoption: adopters from Minnesota (where Floyd was killed) and from Sub.Blacker subdivisions — consistent with the documented role of “Black Twitter” in directing national attention to incidents of police violence (Brock 2012; Hill 2018).
Indeed, early adopters were very likely to have used the hashtag before the study period. This may indicate an activist core that seeks to direct mainstream attention in the aftermath of incidents of police brutality.
Notably, my hypothesis about racial income inequality and police-violence rates being strong predictors of per-capita adoption was only partially confirmed. Broad demographic and density patterns mattered much more than these metrics.
Designing Social Contagion Models
Social contagion models simplify social ideas into probabilities of “infection” and simplify social groups into lattices of nodes, allowing us to look at social phenomenon from the bird’s eye view of network structure. Understanding contagion dynamics may allow movement members to better distribute their message.
To model social contagion, you must account for two key confounders:
- Opacity: you can’t actually see the moment someone was “exposed” to a tweet, which can distort exposure calculations (Berry et al. 2017).
- Homophily: similar people follow each other (McPherson et al. 2001). If similar people are all reacting to the same news, it can look like they inspired each other to act when they did not (Shalizi and Thomas 2011).
To account for opacity, I followed the approach of Fink et al. (2016), constructing randomized log-in schedules for users based on their tweet rate.
To account for homophily, I designed a reference model — the modelling equivalent of a null hypothesis (Hobson et al. 2021):
Reference model — adoption is driven purely by external factors (national news volume mentioning Black Lives Matter and a population’s baseline propensity to adopt).
P(d) = q · news(d)
- q — how much you are influenced by the news
- news(d) — how loud BLM is in the news that day
I then tested my reference model against two contagion models:
Simple contagion model — each exposure to an adopting neighbor carries an independent, fixed probability of triggering adoption. External factors still can trigger adoption.
P = 1 − (1 − p)k + s · q · news(d)
- 1 − (1 − p)k — your feed pulls you in, stronger the more posts you've seen
- p — how persuasive a single friend's tweet is
- k — how many friend-posts you've already seen
- s — how much is still the outside world, not your feed
- q · news(d) — the same external drive as Reference
Complex contagion model — the probability of adopting after an exposure rises as a sigmoid function of how many of a user’s followed accounts have already adopted (i.e., it gets easier to “catch” as more of your peers do it). External factors still can trigger adoption.
P = 1 − ∏k(1 − pk)L[k] + s · q · news(d)
pk = plo + phi − plo1 + e−g(k − k₀)
- 1 − ∏(1 − pk)L[k] — like Simple, but each post's power pk grows as more friends adopt
- k₀ — the tipping point that the sigmoid curve centers around
- g — how sharply the adoption probability increases around the tipping point
- phi — the ceiling on one post's persuasiveness
- s — outside-world share
- q · news(d) — the same external drive as Reference
The news(d) term was quantified as the daily volume of news articles mentioning Black Lives Matter in the Nexis Uni database.
I trained my models using my geolocated adopters dataset, because downloading all adopters’ follower and following lists would have been too time-consuming. Even with a subset of my data, my challenge was enormous.
Amongst all geotagging adopters, there were over 26 million exposures to #BlackLivesMatter tweets in the study period. The average geolocated adopter had 288 exposures. This was a massive social phenomenon.
Training each model was thus very resource intensive. I ran a grid search on my parameters, limiting the search scope to save time, measuring as my cost function the least squares cost between actual and predicted cumulative adoptions by hour.
Do My Contagion Models Explain Hashtag Adoption?
In fact, no - the reference model worked best at explaining user behavior. While the best simple contagion model had a slightly lower cost, that was when it assigned 90% of user behavior to external factors.
This deeply surprised me, given that the contagion models integrated granular information about adopters’ hashtag exposures, while the reference model was blind to individual adopter characteristics.
What this means: Online exposures may not be as important to online behavior as much as offline factors motivate similar users to take similar actions.
Modelling is tricky business. You might argue I made poor design choices in my models that doomed their predictive power. Perhaps with a better-designed training scheme, we could have outperformed the reference model.
In my thesis, I make the argument that you can use contagion models to explain user behavior over the first 48 hours, during which point the news has not yet caught on to the burst of attention directed towards #BlackLivesMatter. You can examine my explanations and make your own decision. Remember that no simple equation can fully capture an individual’s decision to join a movement.
“All models are wrong, but some are useful” - George E. P. Box
If online social contagion does drive early hashtag adoption, then online contagion may be most important in spurring journalists to write news articles, fueling a circular process by which media broadcasts amplify diffusion processes, a process which was suggested in (Freelon et al. 2018).
For a deeper dive into my research, including the theoretical framework, justifications for analytical choices, and discussions of limitations of my research, see the full thesis (PDF).
References
Berry, George, Christopher J. Cameron, Patrick Park, and Michael W. Macy. 2017. “The Opacity Problem in Social Contagion.”
Brock, André. 2012. “From the Blackhand Side: Twitter as a Cultural Conversation.” Journal of Broadcasting & Electronic Media 56(4):529–49.
Brown, Jennings. 2015. “A Year After Michael Brown, Black Lives Still Matter.” Vocativ.
Buchanan, Larry, Quoctrung Bui, and Jugal K. Patel. 2020. “Black Lives Matter May Be the Largest Movement in U.S. History.” The New York Times, July 3.
Derickson, Kate Driscoll. 2017. “Urban Geography II: Urban Geography in the Age of Ferguson.” Progress in Human Geography 41(2):230–44.
Fink, Clay, Aurora Schmidt, Vladimir Barash, John Kelly, Christopher Cameron, and Michael Macy. 2016. “Investigating the Observability of Complex Contagion in Empirical Social Networks.”
Freelon, Deen, Charlton McIlwain, and Meredith Clark. 2018. “Quantifying the Power and Consequences of Social Media Protest.” New Media & Society 20(3):990–1011.
Garza, Alicia, and L. A. Kauffman. 2015. “A Love Note to Our Folks.” N+1.
Hill, Marc Lamont. 2018. “‘Thank You, Black Twitter’: State Violence, Digital Counterpublics, and Pedagogies of Resistance.” Urban Education 53(2):286–302.
Hobson, Elizabeth A., Matthew J. Silk, Nina H. Fefferman, Daniel B. Larremore, Puck Rombach, Saray Shai, and Noa Pinter-Wollman. 2021. “A Guide to Choosing and Implementing Reference Models for Social Network Analysis.” Biological Reviews 96(6):2716–34.
Ince, Jelani, Fabio Rojas, and Clayton A. Davis. 2017. “The Social Media Response to Black Lives Matter: How Twitter Users Interact with Black Lives Matter through Hashtag Use.” Ethnic and Racial Studies 40(11):1814–30.
McPherson, Miller, Lynn Smith-Lovin, and James M. Cook. 2001. “Birds of a Feather: Homophily in Social Networks.” Annual Review of Sociology 27(1):415–44.
Shalizi, Cosma Rohilla, and Andrew C. Thomas. 2011. “Homophily and Contagion Are Generically Confounded in Observational Social Network Studies.” Sociological Methods & Research 40(2):211–39.