Few words can scare a filmmaker more than ‘data.’ To many, the word ‘data’ conjures images of risk-killing executives & AI-generated films taking over Hollywood, the magic of one’s imagination being trapped in a cage of numbers.
But data defines every step of the filmmaking process.
In this essay, I talk about how filmmakers already use data, why data autonomy is so important, and how I used data in directing Angels Everywhere in each stage of the filmmaking process.
Why Filmmakers Need Data
“The greatest compliment I can give the crew as director, while we’re watching the rushes, is ‘good work, we’re making the same movie’.” - Sidney Lumet
Making the same movie means being able to see the same movie. But how can you transmit the film in your head, before it exists in the world?
Often we use data.
We use scripts with data encoded in syntax to map our story, spreadsheets to schedule the set, shot-lists to chart the visual world, editing logs to trim the raw footage into a single narrative.
Whether we’re using a script outline or a shot-list, we are relying on structured information to provide us with a tangible rendering of an otherwise abstract idea. In doing so, we discover the film itself.
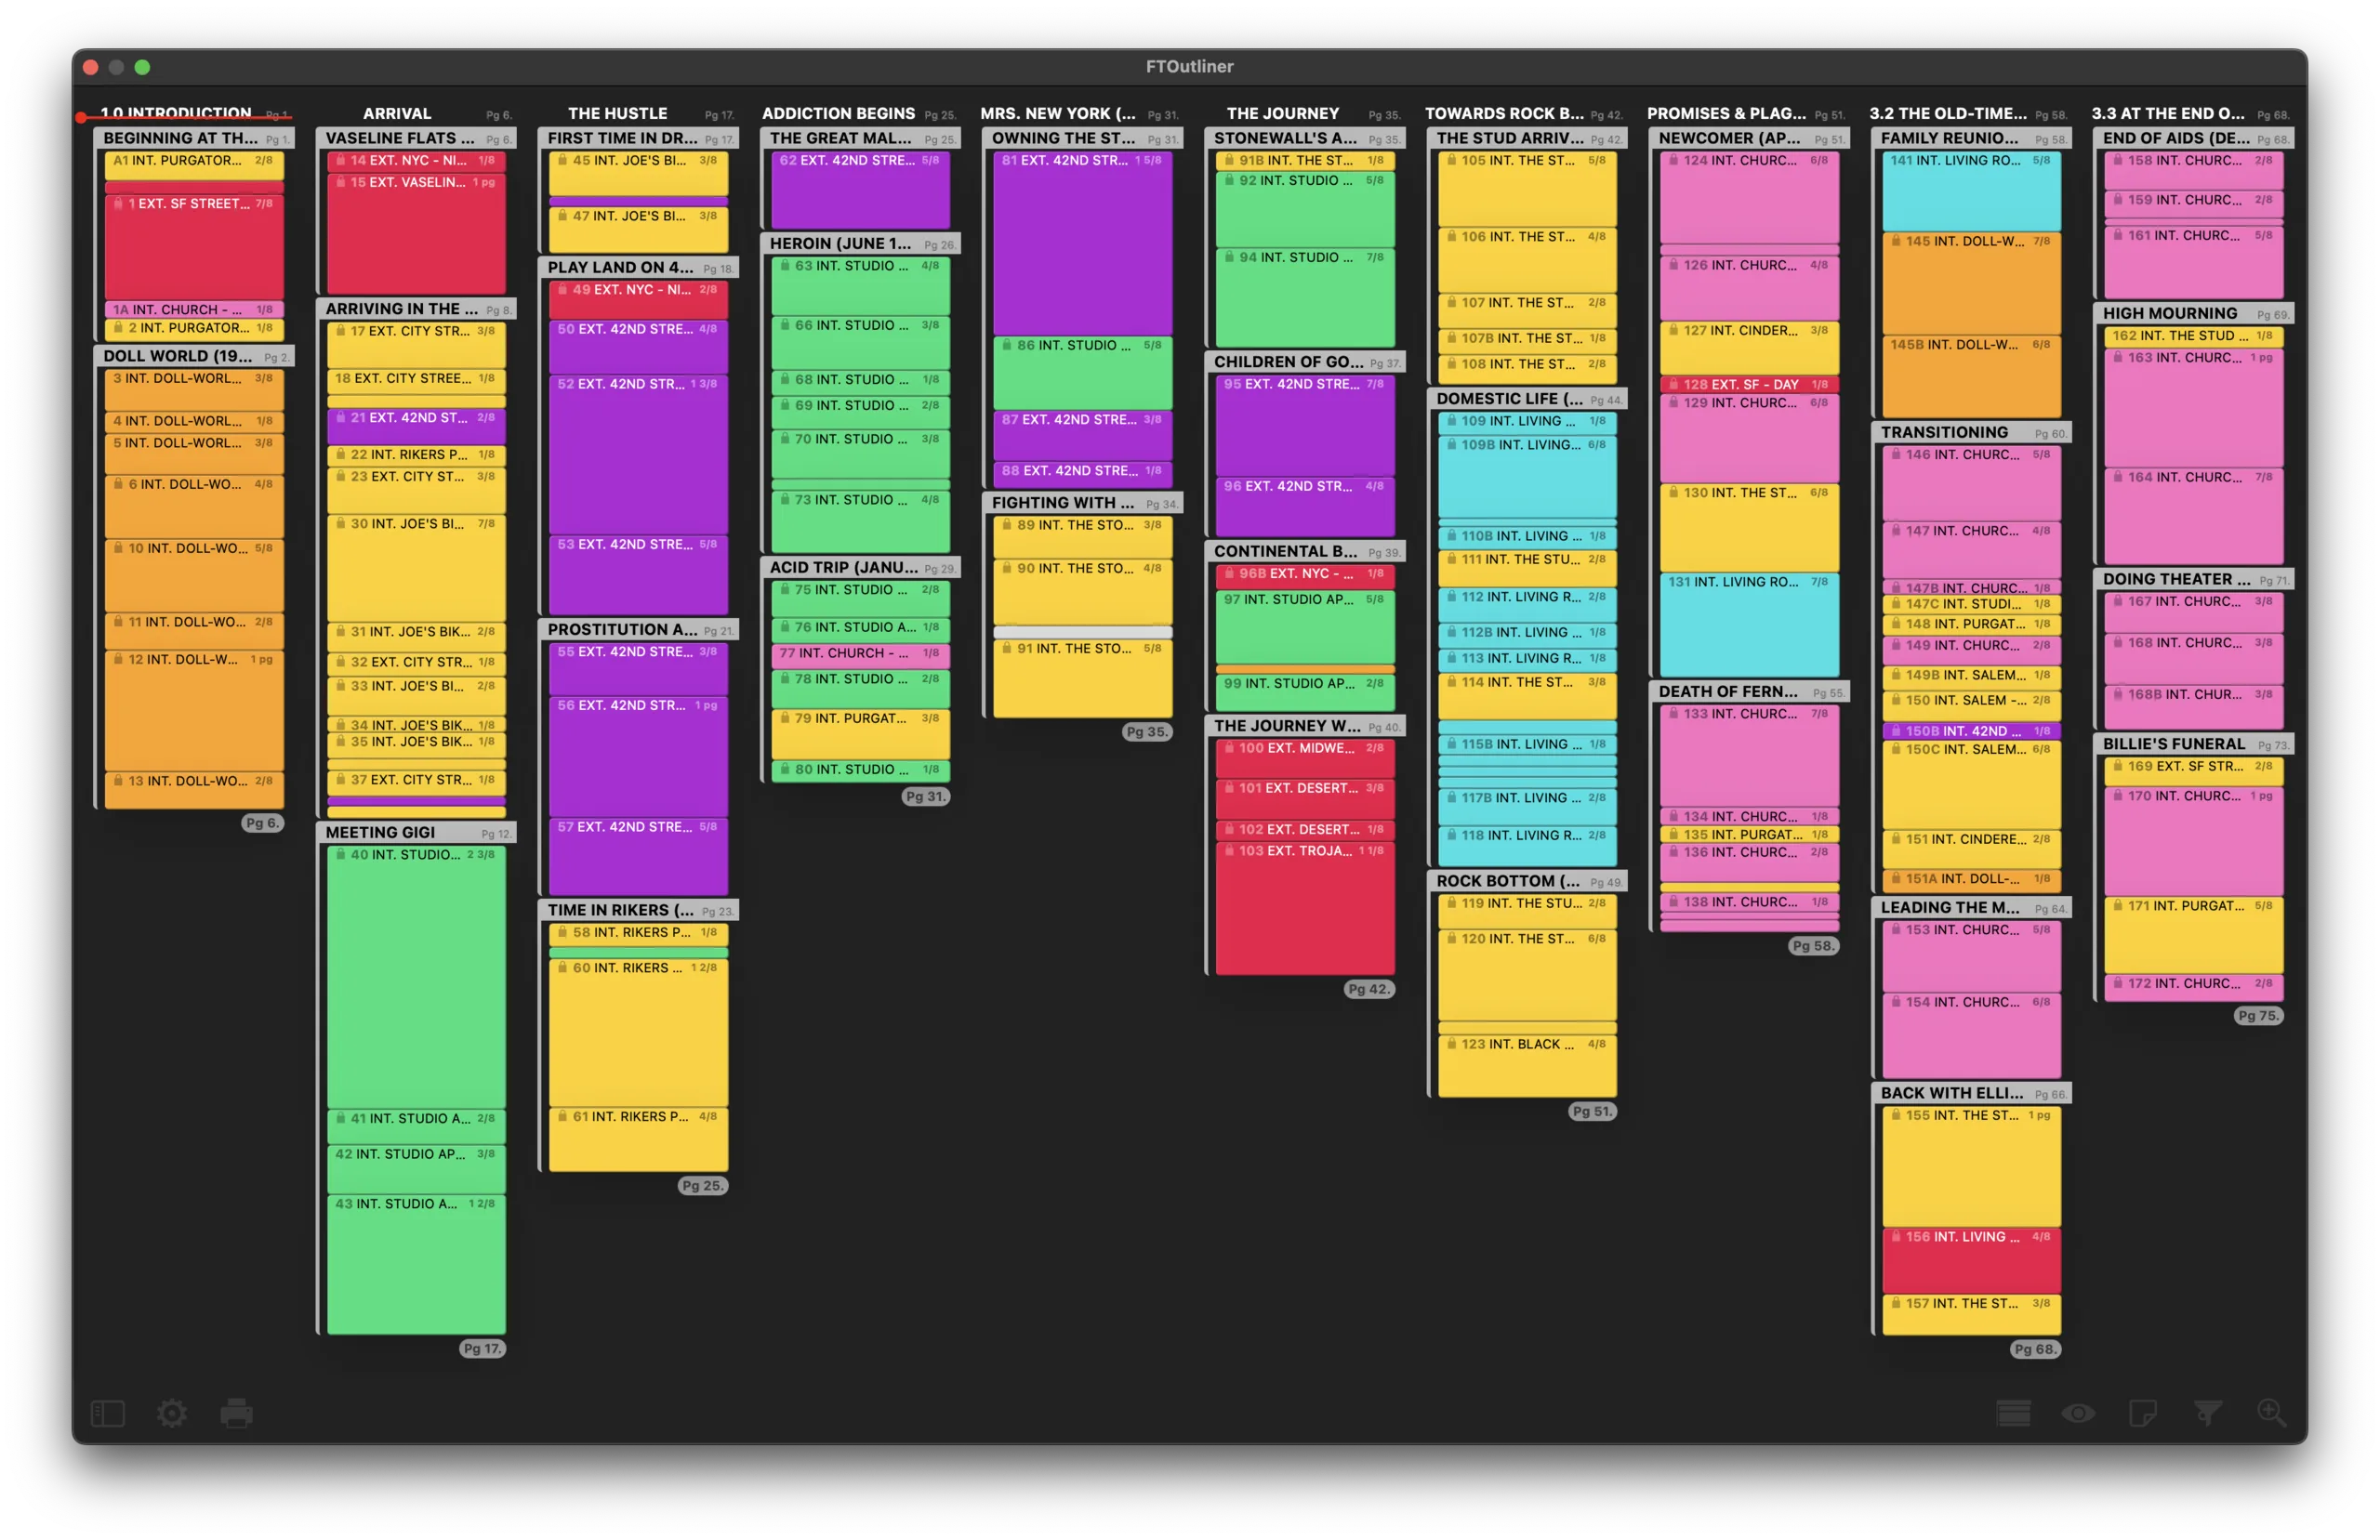
“The greatest possibilities of visual display lie in vividness and inescapability of the intended message… A visual display can force you to notice what you never expected to see.” - John Tukey , pioneer of data visualization
Why You Need Data Autonomy
For me, the tools I use to produce creative works are part of me. My script is part of my mind. I don’t want my script locked up in a software I have to subscribe to access.
My interest in data autonomy and the open data movement began in college, where I conducted research for Professor Brinker Ferguson. We researched how open data can help preserve world heritage.
Consider the following scenario:
- A community hires a company to take a 3d scan of a landmark
- The company that generated the 3d scan goes bankrupt.
- Ten years later, a flood destroys half the landmark.
Did the company use a binary format, uninterpretable to the eye, documented only on company servers, or a widely-documented format used by several companies? The answer may determine whether you can rebuild.
“Data is a precious thing and will last longer than the systems themselves.” — Tim Berners-Lee, World Wide Web founder
Open data means communities control their history. Open data means filmmakers control their work.
In order for data to be open, it must use open file formats, file formats which any program can edit:
“An open format is one that is platform independent, machine readable, and made available to the public without restrictions that would impede the re-use of that information.” - Open Government Directive
When file formats are open, not only are they more reliable, but they are also often free to manipulate, which makes filmmaking more accessible. Data is powerful, and controlling your own data gives you more power as a filmmaker.
Case Study: Data Tools for “Angels Everywhere”
1) Screenwriting: Using Fountain
The industry standard app for screenwriting, Final Draft, costs $199 and saves scripts as proprietary .fdx files.
Instead of using Final Draft, I chose to write my script using Fountain, a markdown-based plain-text syntax for screenplays.
Three key advantages of .fountain files:
- Free - A thriving ecosystem of free editors exist.
- Portable - It is just plain text. Even if Fountain support vanished in fifty years, you could still access your script. You can even write your script in your notes app then import it into a Fountain editor to print it.
- Extensible - Because the syntax is public, you can build tools for your script instead of waiting for a new feature from your editor.
I used the Beat app, a free editor with strong plugin support, but you can pick any Fountain editor you like.
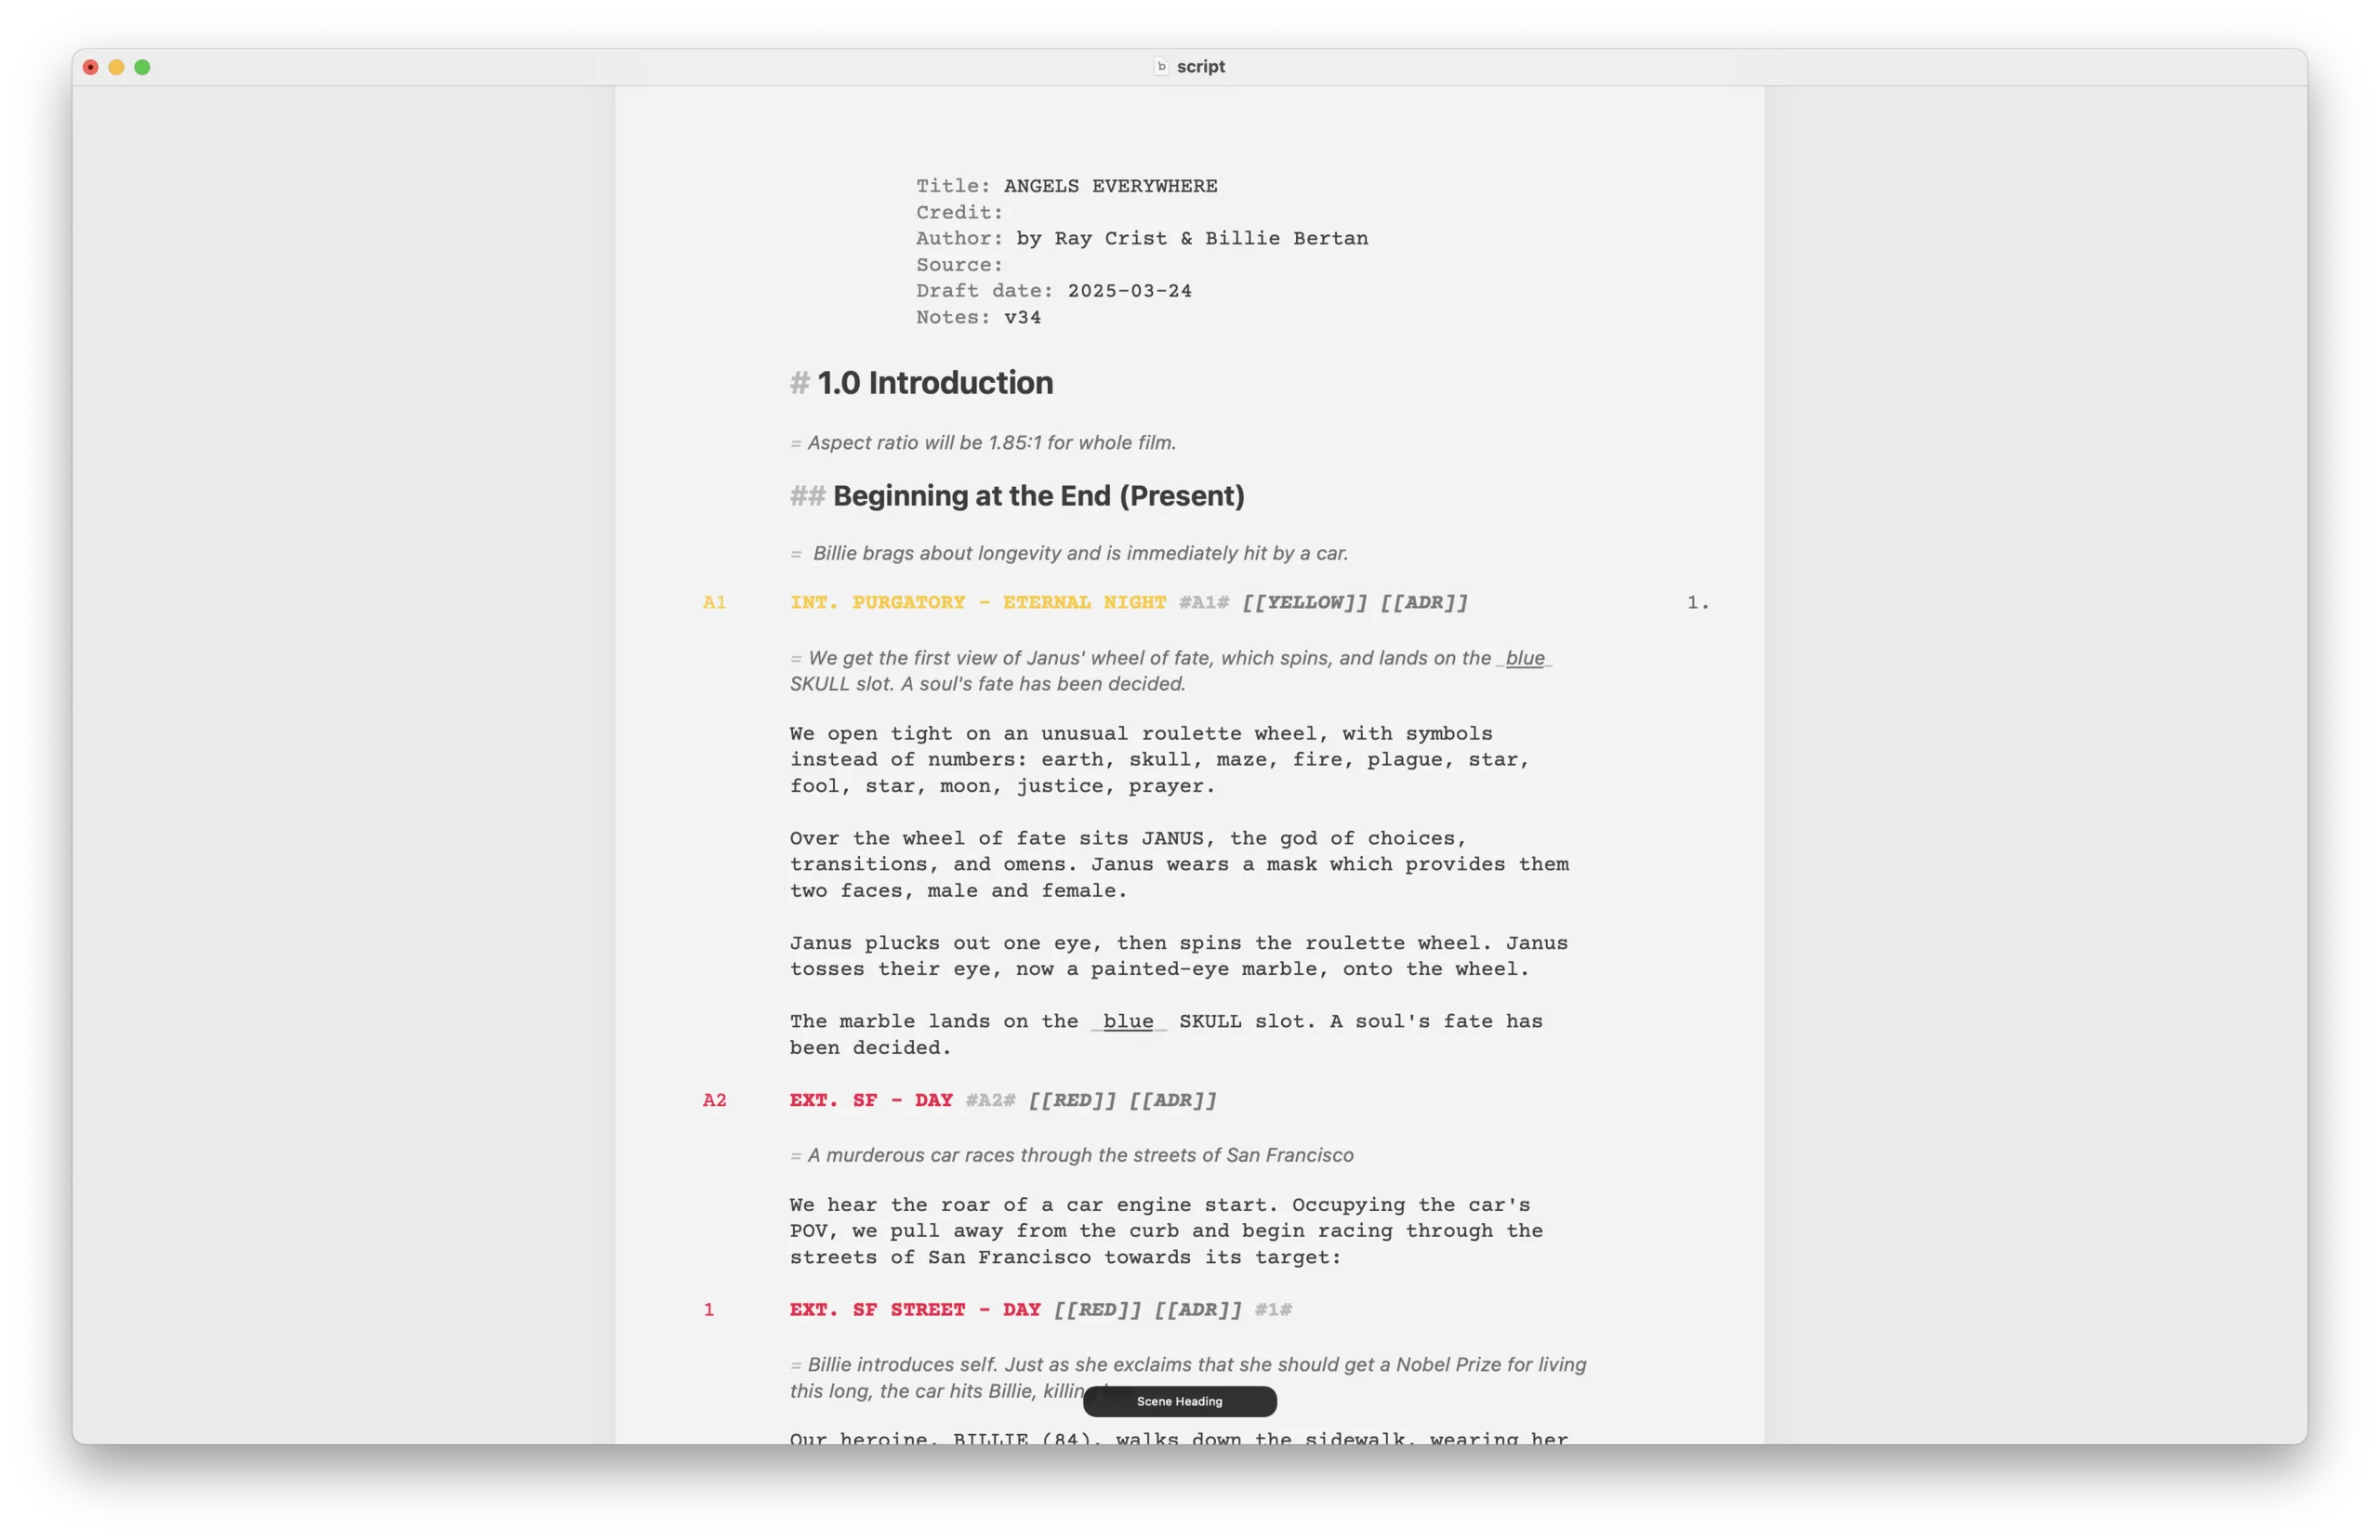
2) Pre-Production: Using Tags for Breakdowns
.fountain is deliberately simple, which means it cannot encode much structured data on its own.
When I began tabulating department needs by scene, this became frustrating. Typically, script breakdowns are conducted by hand, but this means they must be updated every time you revise the script (which, for me, was often).
Instead I used HTML tags to embed the breakdown into the script.
Benefits of HTML tags:
- Markdown parsers typically support HTML tags, so I could piggyback off those existing parsers rather than build my own (at least, at first)
- Using an already-standard schema maximizes familiarity for new users
- HTML tags can be easily stripped from the file, in the event that this experiment failed.
Beat’s editor does not support HTML tags (yet), so I turned to the Markdown editor Obsidian to add them to my script.
Using Obsidian’s Fountain Editor plugin to render my script and Wrap with Shortcuts plugin in order to quickly add tags via hotkeys, I quickly applied syntax like-so across my script:
<span class="actor">Billie</span> drinks from the <span class="prop">chalice</span>.
In Beat, I developed a plugin, Map Appearances by Scene, which is now part of the official plugins library, to tabulate entities’ appearances by scene.
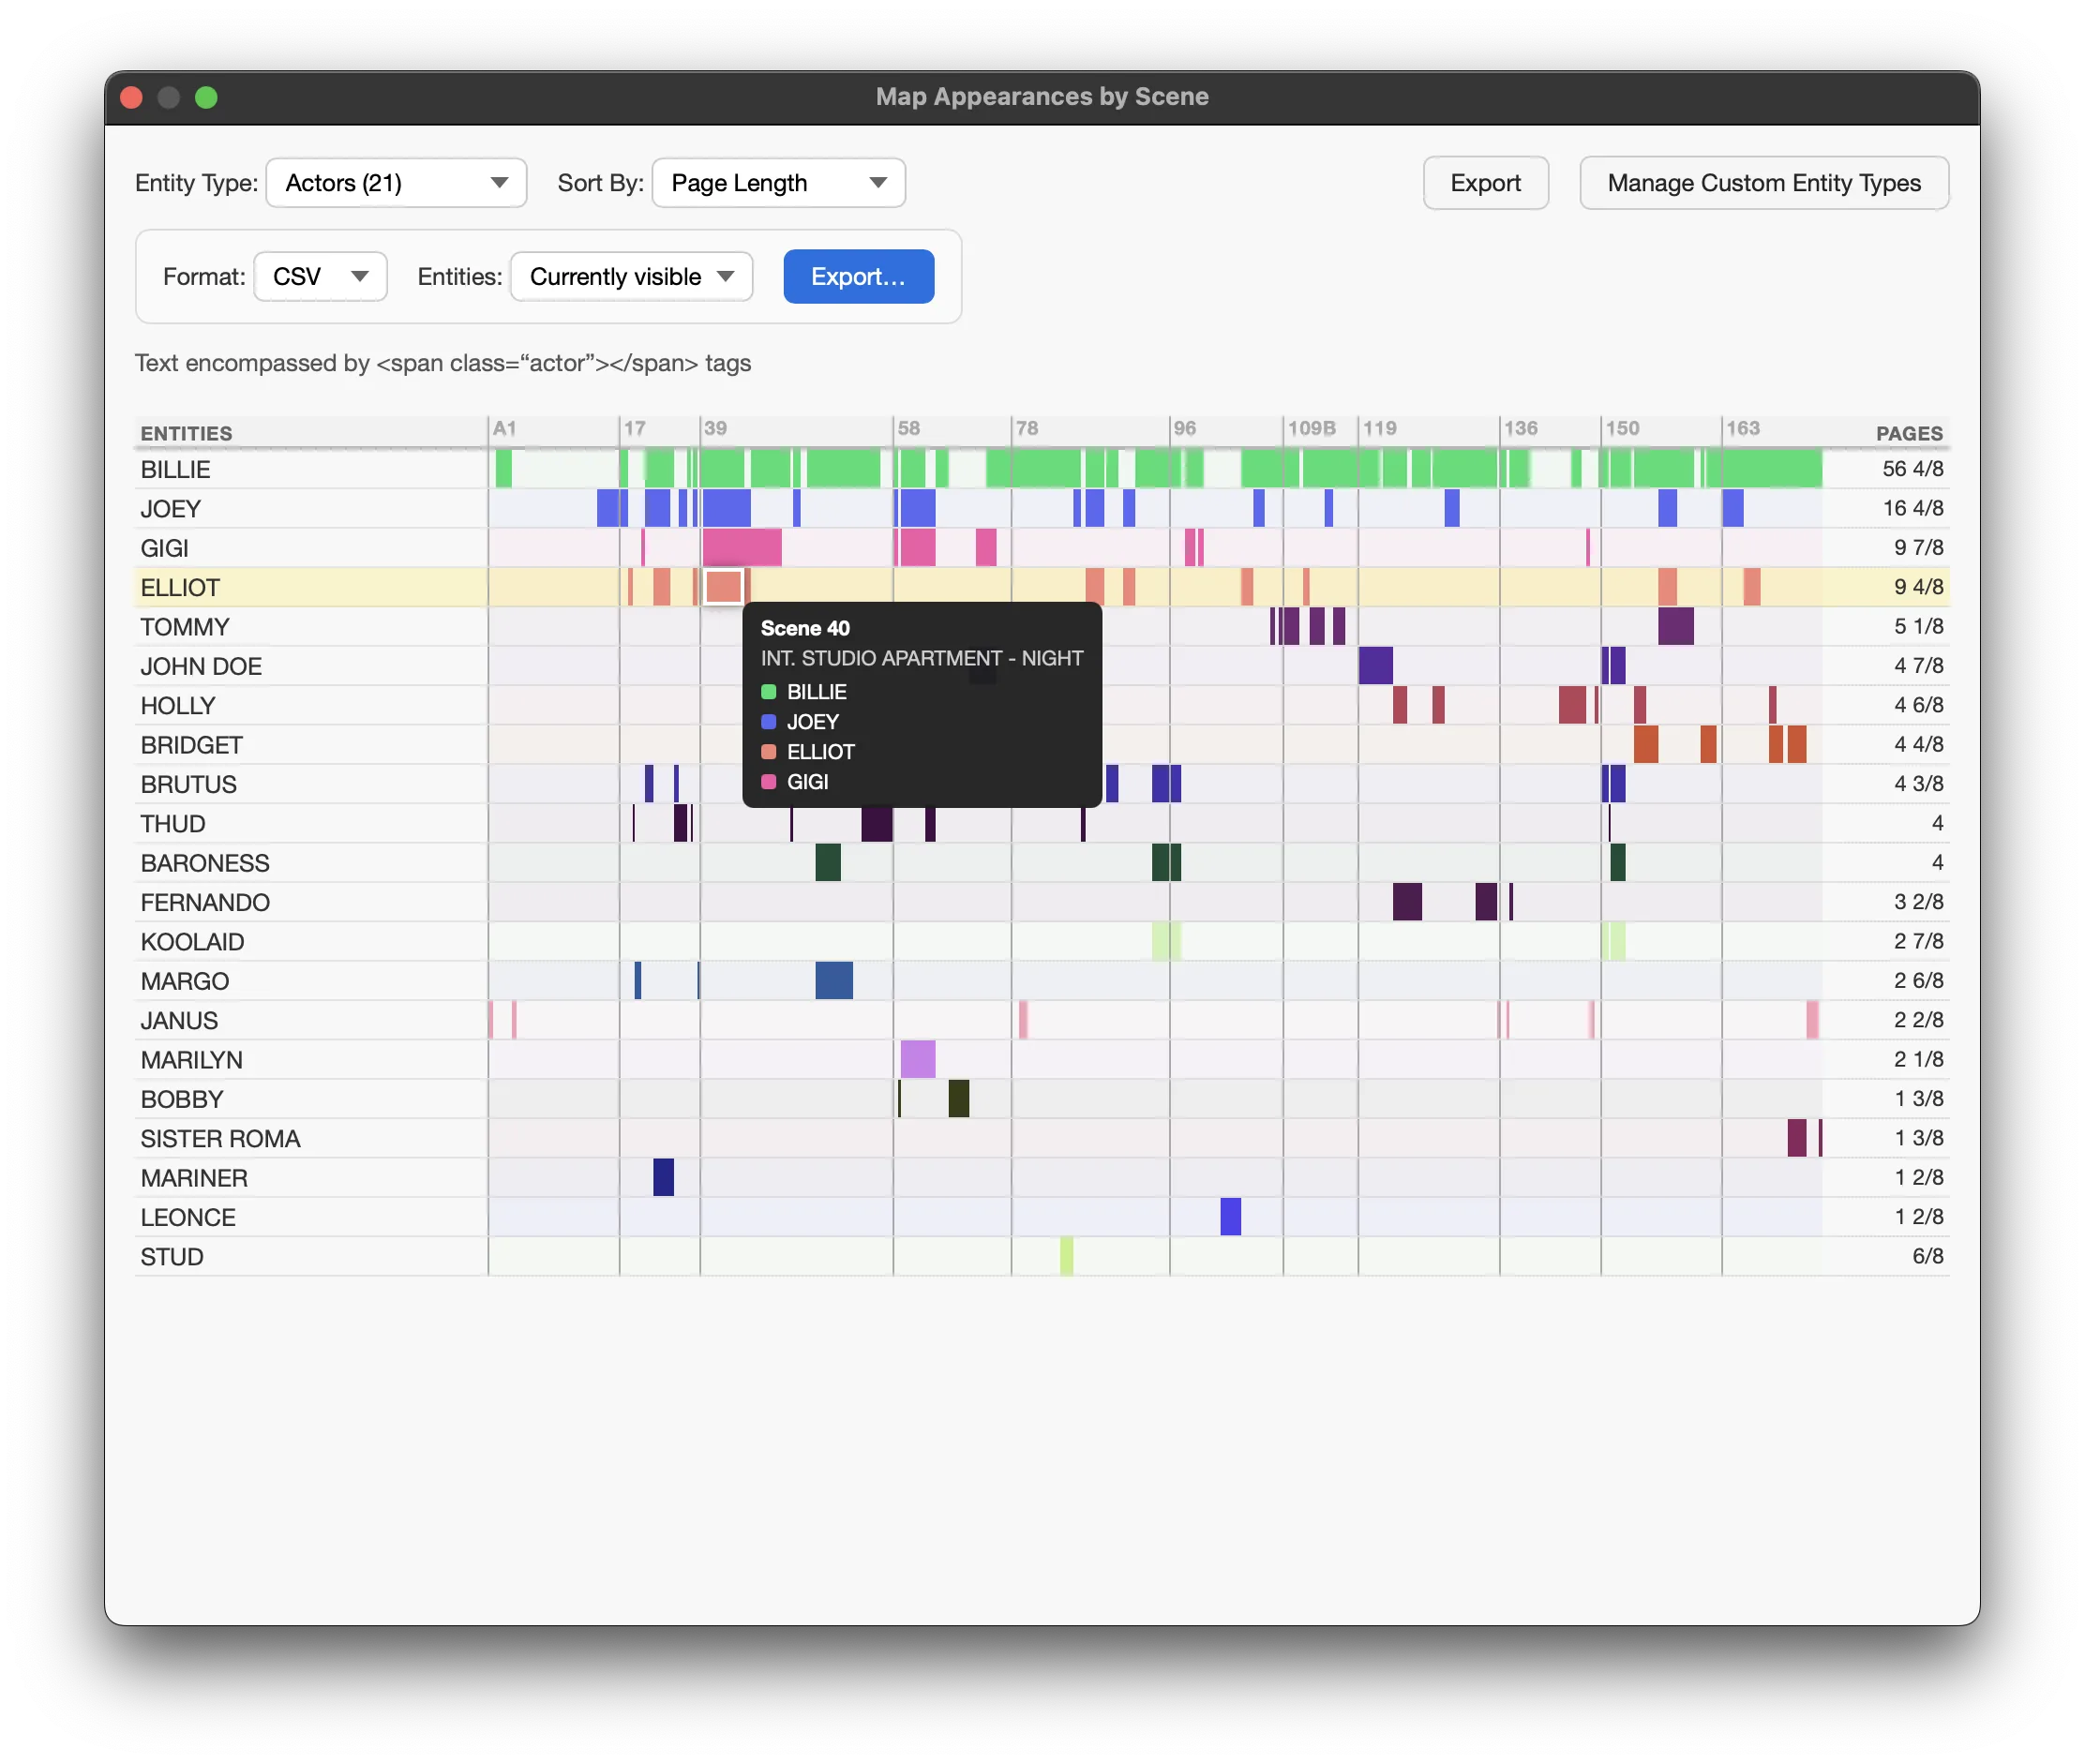
My plugin supports defining entities (break down components) by RegEx, which can parse HTML, as well as any schema that the user defines, if other users choose alternative syntax, i.e. [[prop=propName]].
That’s the benefit of an open format: you can choose your own system, and you can build the tool you need that your app doesn’t already have.
With my Map Appearances plugin, I can see spatially how characters move in the scene. Which characters appear for a fleeting instant? Which characters find each other sharing scenes over and over again?
Finally, I can export my break down to CSV / JSON for the next phase: production.
I mainly used the breakdown tool to track how much I was asking of my own team, rather than sharing them with my team (who used their own breakdown tools) due to time constraints!
3) Production: Using Relational Databases for Fast Updates
As filming approached, the script became less important than the all-important shot-list: what we shot and how we shot it.
We filmed over 10 days broken into two blocks, with a five-week intermission.
During our first filming block, our data lived in Google Sheets. This worked OK but had major pain points. Decoupling the visuals of the data with the underlying data is difficult, which led to several views being updated manually. As we grew increasingly fatigued after several 12-hour days, manual data modification fell down the priority list, and our schedule suffered.
During the intermission, I decided to build a new system of production management using relational databases.
I chose AirTable for its user-friendly nature and a lot of out-of-the-box support for building user interfaces. I built views that rendered shots and looks by day and by story order, which allowed all our teams to quickly prepare for the next shot while also tracking story flow. We were also able to identify scheduling optimizations - where we might re-order scenes to eliminate a makeup change, for example.
“Graphics is the visual means of resolving logical problems.” – Jacques Bertin, Graphics and Graphic Information Processing, 2011, p. 16.
AirTable is not open-source, but its easy export features mean I can store the underlying data and reproduce the user-interface if I had to.
Your tools are only valuable if your team uses them, though, and I soon found my team did not love AirTable as I did. Print is still king on film sets, and AirTable lacks an effective print-out feature.
To meet our needs, my partner wrote a script that exported print-outs for each day, which we printed in mass at the start of each day.
This was the best of both worlds. The raw data kept a single source of truth, which I could update on my laptop between filming scenes, and everyone got access to that data in a familiar format.
Morale rose on set as we hit faster timelines and departments did not waste time trying to parse unclear instructions. Most importantly, these tools gave us more time to explore fresh ideas and more opportunities to experiment with our film’s visual language, helping to clarify our vision.
4) Post-Production: Connecting Footage to Metadata
Now, I’m in the phase of editing the film, which means a new phase of data wrangling, where I am now primarily concerned with clips - 577 so far.
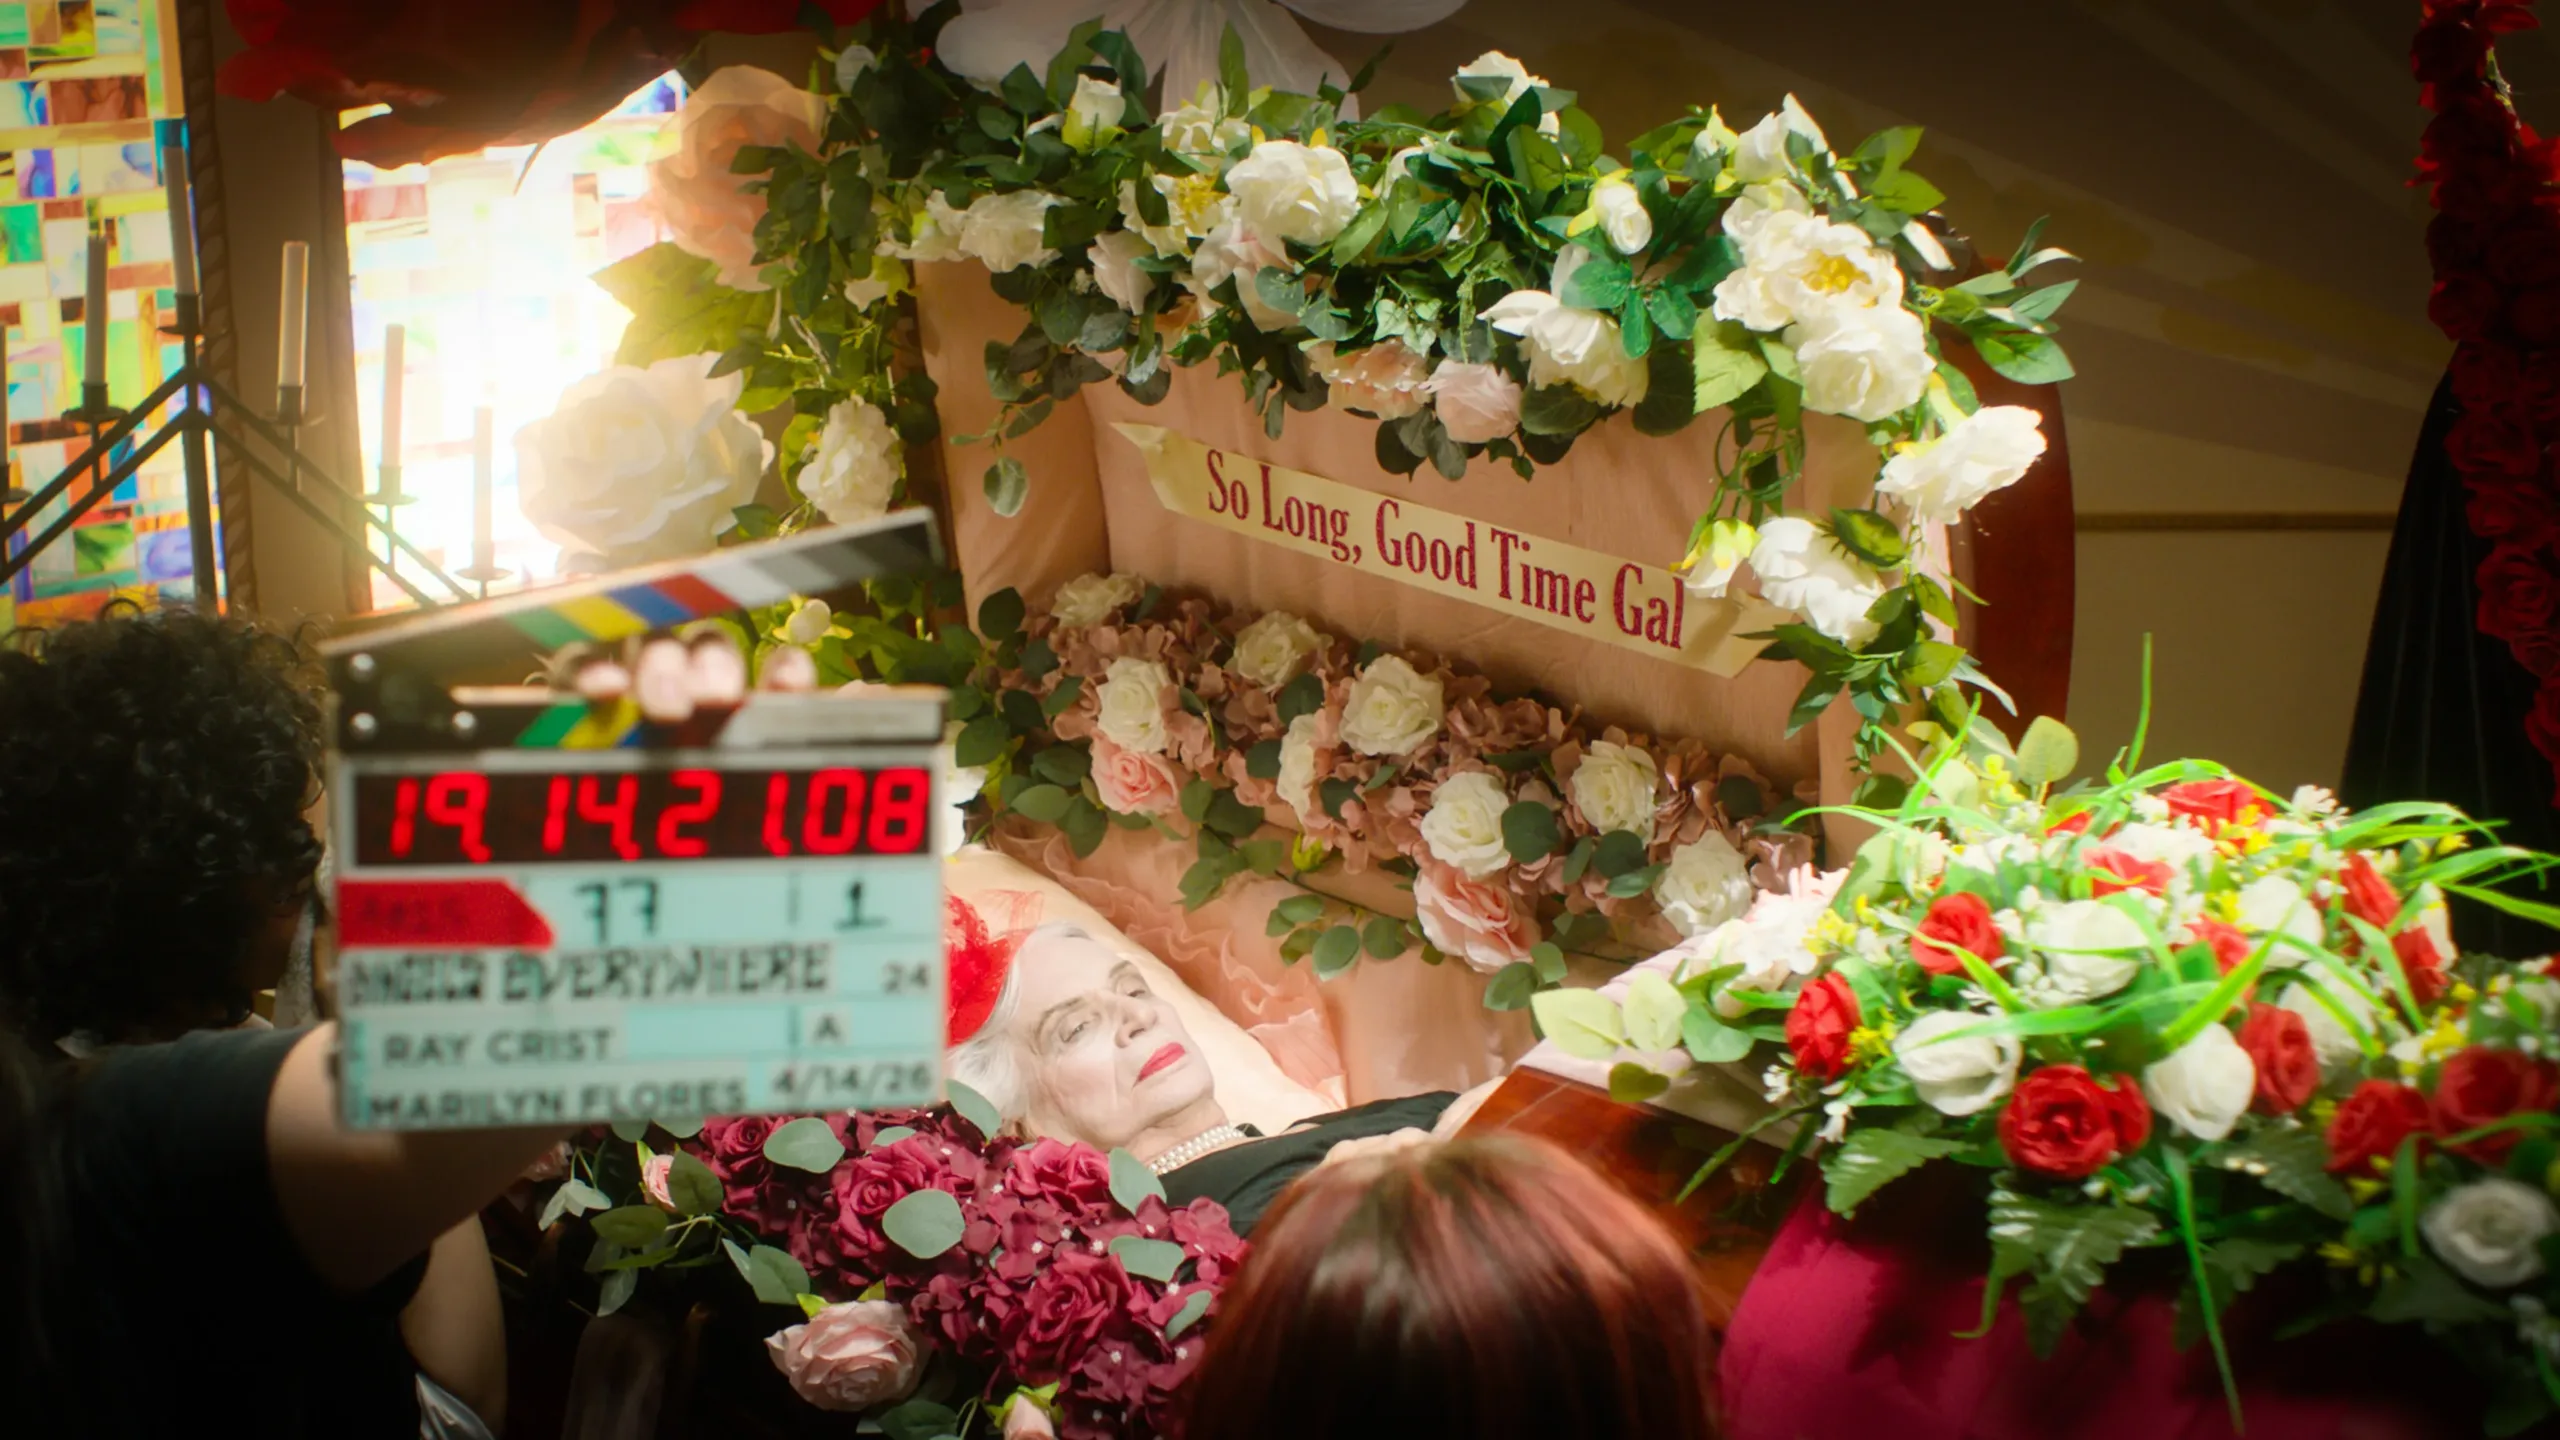
Film footage has always been embedded with metadata - the slate functions to encode metadata into the image itself, with details about shot and time - but leafing through frames by hand is not the easiest lookup (surely, an AI could do this automatically now, but I had other options).
During filming, our script supervisor entered details about every take into ScriptE, a software used by many productions to generate script reports. It is in some ways an exceedingly powerful tool, but it exports its findings mainly into PDF files, which means the data is trapped in the layout, unparseable for my editing software.
Luckily, ScriptE does have an XML export feature available for daily reports, which generates an XML of the script coverage and shots per day.
I wrote a python script in order to match the ScriptE take data with the raw clips, matching takes to clips based on file created time and by order of file creation, and to generate a CSV with all clip metadata.
I imported this CSV into Davinci Resolve, my editing software, so now I am able to find all takes which we noted as the best on set, broken down by location, scene, shot, and annotated by contents.
I also generated an interactive lined script, which I use to speed up the assembly cut & show my coverage at a glance.
The benefit of XML is that it does define its schema well enough that you don’t necessarily need a schema to parse (which is good, because ScriptE does not publish a schema!).
Takeaways
I am certainly in a tiny minority of filmmakers where, when I identify a problem, my brain instantly goes towards, how can I code a solution for this?
Obviously, you do not need to be a software engineer to be a filmmaker (good!).
But you do not need to code to benefit from the core ideas:
- Choose tools that ensure you control your own data
- Build tools for the team you have
- Use data to visualize your story